Grid Map
grid-map is a personal project that is a solution for displaying a dense number of points in d3.js map visualizations.
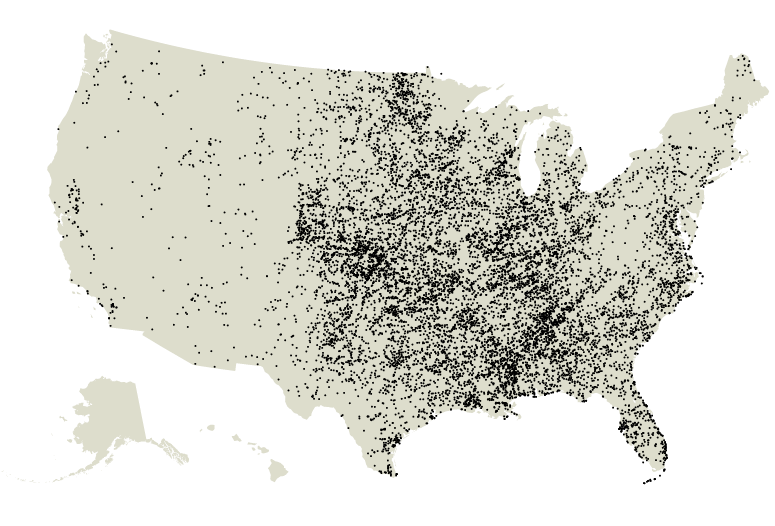
I used tornado data from NOAA's Storm Prediction Center page and plotted all tornadoes from 2005 to 2014 using d3.js. The result looked like this:

Displaying all tornadoes from 2005 to 2014. That's a lot of points.
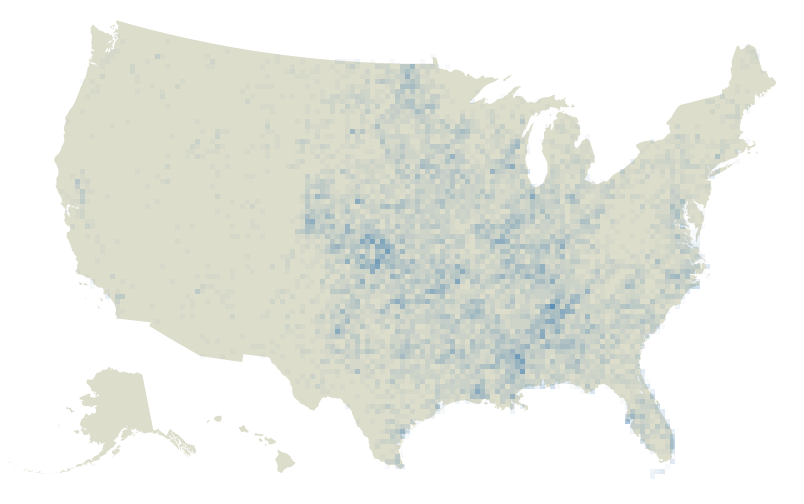
I used D3's QuadTree to help me calculate the number of points in a "cell." Based on that number, I filled in that cell with the correct intensity of color (the darker the cell, the more points there are in that cell).

Using grid-map to aggregate points in an area.
You can check out the project on GitHub .