Keen IO Explorer
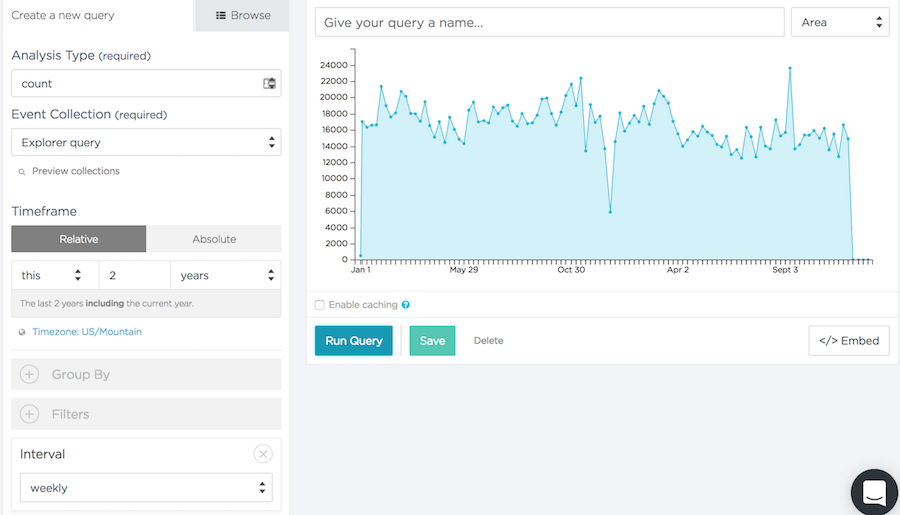
The Keen IO Explorer is an interface our team built to allow customers to visualize the data they stored on the Keen IO platform. The Explorer allowed users to view the streams they created, run queries, visualize data in various dimensions, and manage saved/cached queries on their account. The query's graphs also generated a embeddable JavaScript snippet so users could embed the graph anywhere they want. The application was used often by our customers, as displayed in the Explorer query below.

Keen IO employees also used the Explorer interally on a daily basis to share important engineering and customer metrics.
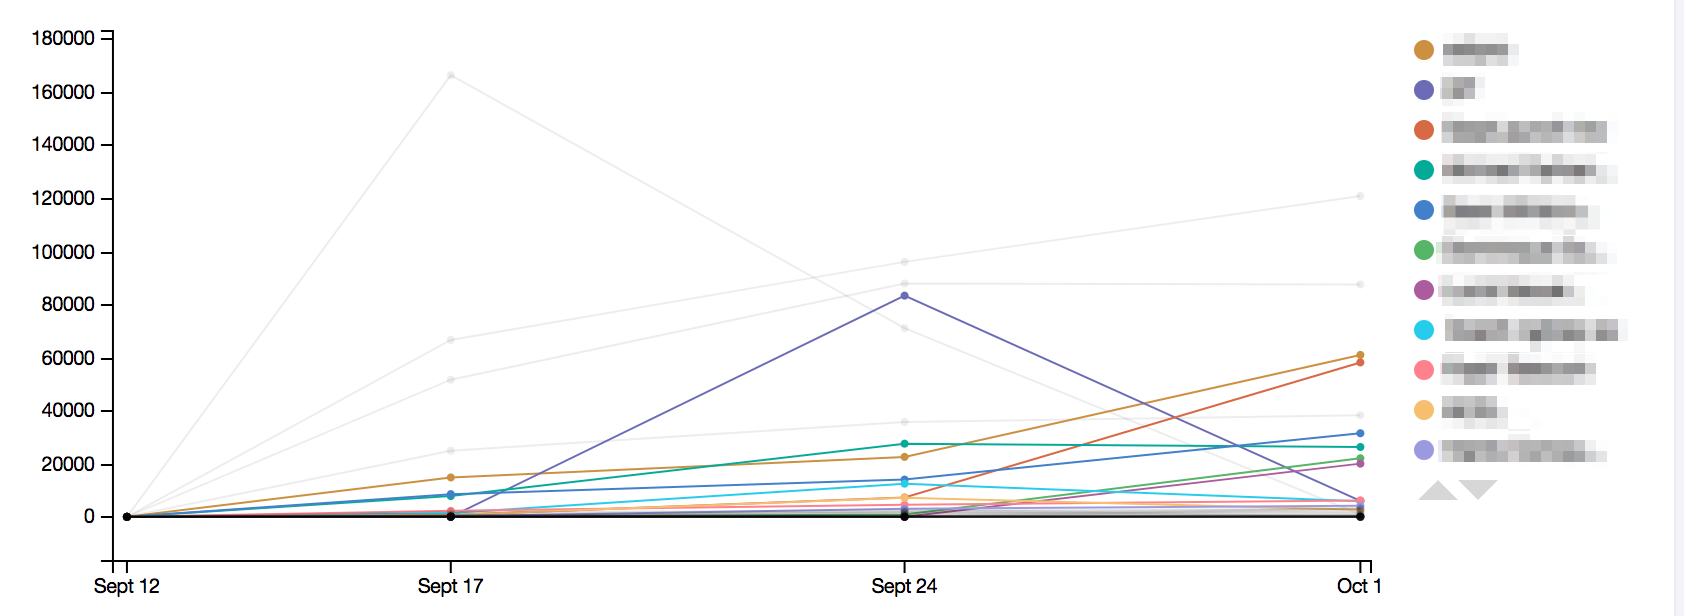
Handling large results with many attributes was a problem we frequently encountered in the Explorer. For example, a "Group By" query returns results grouped by a selected field. Often times, the number of unique field values would be very large. The Explorer uses C3.js to generate the graphs that displays Keen data. Unforuntately, C3.js would cause our graph labels to overflow when there were too many group-by values to display. Below is the solution we designed and developed to paginate our legends and data when we couldn't display all groups in one graph.

11 groups would be displayed at once, and the user would be able to flip through various "pages" of groups. The entire data set returned from the query is still visible on the graph, but they are greyed out to avoid any confusion. This allowed us to accurately display all the data returned from the query, while still allowing the user to focus on the data displayed on the current "page."
The project was built with React with ES6 JavaScript, and the source code is available on GitHub.